The short answer
Angel number statistics at a glance
444 draws the most interest of any angel number on Google in the United States: over the past five years, 333 ran at 96% of 444’s level, 222 at 90%, and 555 at 76%, and 444 is the top number in 47 of the 50 states.
- 444leads the nation. Next come 333 (96), 222 (90), 555 (76), 111 (49), 1111 (45), and 777 (34), with 444 = 100.
- Nevadascores 100 for 15 of 20 numbers and is in the top five for all 20. Georgia scores 100 for six.
- 47 of 50states have 444 as their top number, eight of them tied with 333. The exceptions: 222 in Massachusetts and 333 in Arizona, DC, and Utah, each within sampling noise.
- Summer16 of 20 numbers peak between May and August. June is the most common peak (nine numbers).
- −50%median change over five years. All 20 numbers draw less interest now than in the 52 weeks from September 2021.
State by state
Where each number draws the most interest
Pick a number to map it. Google Trends scores each state from 1 to 100 against that number’s top state, so the maps show where a number stands out, not how many people look it up. Hatched states had too little data for Trends to report.
Where “444 angel number” draws the most interest
Each state’s interest relative to the top state (100) for 444. Every number has its own scale, so compare states, not colors between maps.
Highest for 444
Nevada
100 / 100
Point at a state or use the slider.
Relative interest
- 1–20
- 21–40
- 41–60
- 61–80
- 81–100
- Insufficient data
Top five for 444: Nevada 100 · Louisiana 86 · Georgia 84 · Hawaii 75 · Mississippi 74
Map shows 444 angel number. Highest: Nevada.
The table below lists every state’s value for every number.
Every state’s value for every number. Each column is scaled to its own top state (100); a dash means insufficient data. Sort by any column.
| Alabama | 68 | 65 | 67 | 65 | 67 | 71 | 50 | 48 | 70 | 58 | 76 | 53 | 63 | 74 | 88 | 40 | 66 | 90 | 77 | 85 |
|---|---|---|---|---|---|---|---|---|---|---|---|---|---|---|---|---|---|---|---|---|
| Alaska | 43 | 39 | 41 | 40 | 41 | 47 | 40 | 30 | 40 | 46 | 40 | 41 | 58 | 67 | 38 | 25 | 60 | 40 | 77 | 71 |
| Arizona | 72 | 74 | 71 | 74 | 67 | 70 | 59 | 56 | 71 | 78 | 66 | 60 | 63 | 61 | 77 | 35 | 80 | 70 | 66 | 57 |
| Arkansas | 60 | 54 | 60 | 52 | 49 | 59 | 54 | 49 | 66 | 61 | 64 | 60 | 56 | 70 | 77 | 25 | 53 | 60 | 66 | 57 |
| California | 73 | 67 | 72 | 71 | 65 | 66 | 72 | 67 | 69 | 78 | 66 | 81 | 68 | 51 | 66 | 60 | 73 | 60 | 55 | 57 |
| Colorado | 57 | 51 | 55 | 50 | 48 | 56 | 50 | 40 | 48 | 50 | 46 | 43 | 51 | 58 | 55 | 25 | 60 | 60 | 55 | 57 |
| Connecticut | 53 | 52 | 57 | 54 | 49 | 51 | 50 | 46 | 51 | 58 | 49 | 53 | 53 | 48 | 61 | 35 | 60 | 40 | 55 | 42 |
| Delaware | 59 | 58 | 62 | 63 | 62 | 67 | 81 | 63 | 69 | 80 | 67 | 73 | 73 | 77 | 88 | 70 | 100 | 90 | 88 | 85 |
| District of Columbia | 45 | 45 | 49 | 45 | 47 | 57 | 51 | 46 | 60 | 62 | 57 | 51 | 53 | 48 | 61 | 40 | 66 | 70 | 55 | 85 |
| Florida | 59 | 60 | 65 | 57 | 55 | 72 | 51 | 45 | 69 | 56 | 70 | 48 | 58 | 58 | 66 | 25 | 60 | 60 | 66 | 71 |
| Georgia | 84 | 80 | 93 | 82 | 77 | 100 | 81 | 70 | 100 | 77 | 100 | 78 | 85 | 74 | 94 | 50 | 86 | 100 | 100 | 100 |
| Hawaii | 75 | 56 | 62 | 60 | 59 | 61 | 72 | 69 | 55 | 78 | 57 | 77 | 75 | 54 | 55 | 30 | 60 | 60 | 55 | 42 |
| Idaho | 45 | 41 | 45 | 42 | 43 | 50 | 41 | 38 | 43 | 54 | 41 | 43 | 48 | 64 | 55 | 25 | 53 | 40 | 33 | 28 |
| Illinois | 64 | 57 | 60 | 55 | 56 | 62 | 55 | 50 | 62 | 64 | 64 | 58 | 53 | 54 | 55 | 35 | 66 | 60 | 66 | 57 |
| Indiana | 54 | 52 | 51 | 51 | 47 | 59 | 50 | 40 | 46 | 48 | 45 | 43 | 48 | 64 | 61 | 30 | 53 | 50 | 55 | 57 |
| Iowa | 46 | 39 | 42 | 36 | 34 | 38 | 36 | 36 | 33 | 48 | 33 | 37 | 39 | 48 | 44 | 35 | 46 | 30 | 33 | 42 |
| Kansas | 46 | 41 | 45 | 39 | 39 | 43 | 45 | 46 | 39 | 49 | 37 | 51 | 43 | 48 | 55 | 55 | 53 | 40 | 44 | 42 |
| Kentucky | 52 | 47 | 54 | 46 | 46 | 48 | 46 | 43 | 49 | 57 | 45 | 48 | 48 | 58 | 55 | 50 | 53 | 50 | 44 | 28 |
| Louisiana | 86 | 73 | 89 | 85 | 80 | 92 | 89 | 75 | 76 | 72 | 76 | 91 | 75 | 74 | 88 | 55 | 80 | 100 | 88 | 85 |
| Maine | 38 | 36 | 40 | 40 | 37 | 40 | 43 | 37 | 40 | 48 | 37 | 43 | 46 | 48 | 55 | 20 | 40 | 40 | 55 | 57 |
| Maryland | 65 | 60 | 66 | 62 | 61 | 72 | 62 | 64 | 74 | 78 | 71 | 62 | 68 | 58 | 72 | 50 | 73 | 80 | 77 | 85 |
| Massachusetts | 45 | 44 | 54 | 45 | 41 | 46 | 48 | 39 | 35 | 46 | 35 | 41 | 41 | 38 | 44 | 25 | 40 | 40 | 44 | 42 |
| Michigan | 62 | 54 | 61 | 52 | 53 | 59 | 54 | 49 | 61 | 64 | 62 | 49 | 53 | 64 | 72 | 35 | 73 | 60 | 55 | 57 |
| Minnesota | 43 | 37 | 43 | 40 | 40 | 41 | 40 | 37 | 37 | 48 | 35 | 43 | 36 | 48 | 55 | 20 | 53 | 30 | 33 | 28 |
| Mississippi | 74 | 66 | 75 | 64 | 63 | 73 | 61 | 60 | 81 | 70 | 83 | 70 | 70 | 77 | 88 | 45 | 73 | 80 | 66 | 100 |
| Missouri | 52 | 50 | 53 | 48 | 51 | 59 | 42 | 36 | 55 | 48 | 55 | 37 | 48 | 67 | 72 | 25 | 66 | 70 | 55 | 57 |
| Montana | 42 | 40 | 42 | 41 | 35 | 46 | 40 | 30 | 39 | 46 | 37 | 35 | 41 | 70 | 44 | 15 | 60 | 40 | 44 | 28 |
| Nebraska | 47 | 44 | 50 | 42 | 43 | 45 | 54 | 43 | 48 | 66 | 41 | 50 | 46 | 61 | 55 | 50 | 53 | 60 | 44 | 57 |
| Nevada | 100 | 100 | 100 | 100 | 100 | 99 | 100 | 100 | 88 | 100 | 85 | 100 | 100 | 100 | 100 | 100 | 93 | 100 | 88 | 100 |
| New Hampshire | 37 | 35 | 40 | 38 | 31 | 35 | 41 | 34 | 37 | 44 | 37 | 40 | 39 | 48 | 38 | 25 | 46 | 30 | 33 | 28 |
| New Jersey | 53 | 52 | 56 | 54 | 52 | 50 | 50 | 43 | 53 | 60 | 55 | 43 | 46 | 51 | 61 | 25 | 66 | 50 | 55 | 57 |
| New Mexico | 69 | 62 | 69 | 62 | 58 | 66 | 65 | 56 | 67 | 68 | 63 | 72 | 68 | 70 | 72 | 65 | 73 | 80 | 77 | 85 |
| New York | 48 | 47 | 50 | 47 | 43 | 48 | 45 | 42 | 58 | 53 | 51 | 43 | 51 | 45 | 44 | 25 | 53 | 60 | 55 | 57 |
| North Carolina | 62 | 58 | 63 | 55 | 59 | 62 | 56 | 49 | 60 | 66 | 66 | 59 | 56 | 54 | 66 | 30 | 66 | 60 | 66 | 71 |
| North Dakota | 44 | 35 | 38 | 39 | 34 | 36 | 46 | 32 | 38 | 48 | 38 | 45 | 41 | 64 | 61 | 45 | 53 | 30 | 55 | 42 |
| Ohio | 53 | 52 | 55 | 50 | 47 | 55 | 48 | 48 | 54 | 57 | 54 | 46 | 46 | 58 | 66 | 30 | 60 | 50 | 55 | 42 |
| Oklahoma | 61 | 54 | 58 | 58 | 56 | 50 | 48 | 51 | 55 | 69 | 57 | 65 | 56 | 67 | 72 | 30 | 66 | 60 | 55 | 57 |
| Oregon | 45 | 45 | 49 | 48 | 48 | 43 | 44 | 43 | 40 | 53 | 40 | 43 | 41 | 51 | 44 | 25 | 53 | 40 | 44 | 42 |
| Pennsylvania | 48 | 49 | 54 | 50 | 50 | 48 | 52 | 48 | 51 | 60 | 54 | 50 | 46 | 48 | 55 | 40 | 60 | 50 | 55 | 57 |
| Rhode Island | 54 | 53 | 56 | 56 | 59 | 50 | 72 | 70 | 50 | 81 | 55 | 78 | 56 | 54 | 61 | 35 | 60 | 50 | 55 | 57 |
| South Carolina | 71 | 66 | 70 | 62 | 63 | 70 | 77 | 53 | 60 | 57 | 62 | 64 | 58 | 54 | 77 | 30 | 66 | 70 | 55 | 71 |
| South Dakota | 43 | 42 | 44 | 42 | 44 | 45 | 40 | 35 | 49 | 44 | 41 | 41 | 41 | 74 | 50 | 20 | 46 | 20 | insufficient data | 28 |
| Tennessee | 60 | 57 | 59 | 56 | 56 | 59 | 58 | 51 | 55 | 56 | 57 | 55 | 56 | 58 | 66 | 35 | 66 | 80 | 66 | 57 |
| Texas | 64 | 62 | 66 | 65 | 62 | 67 | 67 | 56 | 66 | 74 | 66 | 62 | 70 | 61 | 55 | 40 | 60 | 60 | 55 | 57 |
| Utah | 59 | 60 | 66 | 58 | 55 | 55 | 51 | 45 | 56 | 60 | 50 | 49 | 58 | 74 | 61 | 30 | 80 | 60 | 55 | 57 |
| Vermont | 34 | 31 | 33 | 33 | 32 | 35 | 31 | 31 | 33 | 37 | 27 | 29 | 41 | 38 | 38 | insufficient data | 53 | insufficient data | 55 | insufficient data |
| Virginia | 50 | 47 | 50 | 50 | 49 | 54 | 54 | 51 | 51 | 61 | 59 | 48 | 48 | 48 | 55 | 30 | 66 | 60 | 55 | 57 |
| Washington | 45 | 42 | 44 | 42 | 41 | 46 | 42 | 36 | 40 | 48 | 35 | 36 | 46 | 48 | 44 | 30 | 53 | 30 | 44 | 42 |
| West Virginia | 40 | 38 | 41 | 41 | 42 | 42 | 40 | 39 | 45 | 57 | 40 | 43 | 36 | 51 | 38 | 20 | 40 | 50 | 33 | 28 |
| Wisconsin | 45 | 41 | 45 | 43 | 40 | 43 | 36 | 33 | 41 | 45 | 41 | 39 | 46 | 51 | 55 | 25 | 46 | 40 | 44 | 28 |
| Wyoming | 42 | 41 | 39 | 41 | 40 | 45 | 36 | 33 | 39 | 48 | 41 | 34 | 43 | 51 | 72 | 25 | 53 | 50 | 100 | insufficient data |
Across the country
The national ranking
To compare numbers with each other, each was pulled in a batch of up to five terms that always included “444 angel number”. That shared anchor puts all 20 on one scale, with 444 = 100. 444 leads; 777, in seventh place, draws 34% of its interest. The last column compares the latest 52 weeks with the first.
| Rank | Number | Interest (444 = 100) | Change (5 years) |
|---|---|---|---|
| 1 | 444 | 100 | −46% |
| 2 | 333 | 96 | −47% |
| 3 | 222 | 90 | −50% |
| 4 | 555 | 76 | −49% |
| 5 | 111 | 49 | −50% |
| 6 | 1111 | 45 | −63% |
| 7 | 777 | 34 | −36% |
| 8 | 888 | 25 | −32% |
| 9 | 1212 | 23 | −60% |
| 9 | 666 | 23 | −35% |
| 11 | 1010 | 22 | −63% |
| 11 | 999 | 22 | −40% |
| 13 | 2222 | 13 | −50% |
| 14 | 1234 | 9 | −60% |
| 15 | 911 | 6 | −66% |
| 16 | 000 | 5 | −62% |
| 16 | 1122 | 5 | −64% |
| 18 | 1313 | 3 | −48% |
| 18 | 1717 | 3 | −44% |
| 20 | 1818 | 2 | −42% |
Head to head
Each state’s top number
Inside each state, the batches also show which number draws the most interest there. 444 is the top number in 47 of the 50 states, including eight exact ties with 333, which we give to the number with more national interest. 222 in Massachusetts and 333 in Arizona, DC, and Utah edge ahead. Trends reports whole numbers on small scales, so a lead of under 10 points (with 444 = 100) is within sampling noise. By that measure, 444 has a clear lead in only 10 states.
- 444 leads
- 333 leads
- 222 leads
- Tie: 444 and 333
The exceptions and ties
| State | Top number | Runner-up | Margin (points, 444 = 100) | Reading |
|---|---|---|---|---|
| Arizona | 333 (104.2) | 444 (100) | 4.2 | Within noise |
| Connecticut | 444 (100) | 333 (100) | 0 | Tie |
| District of Columbia | 333 (104.3) | 444 (100) | 4.3 | Within noise |
| Florida | 444 (100) | 333 (100) | 0 | Tie |
| Massachusetts | 222 (104.2) | 444 (100) | 4.2 | Within noise |
| Nevada | 444 (100) | 333 (100) | 0 | Tie |
| Oregon | 444 (100) | 333 (100) | 0 | Tie |
| Pennsylvania | 444 (100) | 333 (100) | 0 | Tie |
| Rhode Island | 444 (100) | 333 (100) | 0 | Tie |
| Texas | 444 (100) | 333 (100) | 0 | Tie |
| Utah | 333 (104.2) | 444 (100) | 4.2 | Within noise |
| Wyoming | 444 (100) | 333 (100) | 0 | Tie |
All 50 states and DC
| State | Top number | Runner-up | Margin (points, 444 = 100) | Reading |
|---|---|---|---|---|
| Alabama | 444 (100) | 333 (96) | 4 | Within noise |
| Alaska | 444 (100) | 333 (96) | 4 | Within noise |
| Arizona | 333 (104.2) | 444 (100) | 4.2 | Within noise |
| Arkansas | 444 (100) | 333 (88.5) | 11.5 | Clear lead |
| California | 444 (100) | 333 (96) | 4 | Within noise |
| Colorado | 444 (100) | 333 (88.5) | 11.5 | Clear lead |
| Connecticut | 444 (100) | 333 (100) | 0 | Tie |
| Delaware | 444 (100) | 333 (95.8) | 4.2 | Within noise |
| District of Columbia | 333 (104.3) | 444 (100) | 4.3 | Within noise |
| Florida | 444 (100) | 333 (100) | 0 | Tie |
| Georgia | 444 (100) | 333 (95.8) | 4.2 | Within noise |
| Hawaii | 444 (100) | 333 (75.9) | 24.1 | Clear lead |
| Idaho | 444 (100) | 333 (92) | 8 | Within noise |
| Illinois | 444 (100) | 333 (92.3) | 7.7 | Within noise |
| Indiana | 444 (100) | 333 (96) | 4 | Within noise |
| Iowa | 444 (100) | 333 (82.1) | 17.9 | Clear lead |
| Kansas | 444 (100) | 333 (92.3) | 7.7 | Within noise |
| Kentucky | 444 (100) | 333 (88.5) | 11.5 | Clear lead |
| Louisiana | 444 (100) | 222 (92) | 8 | Within noise |
| Maine | 444 (100) | 333 (95.8) | 4.2 | Within noise |
| Maryland | 444 (100) | 333 (92) | 8 | Within noise |
| Massachusetts | 222 (104.2) | 444 (100) | 4.2 | Within noise |
| Michigan | 444 (100) | 333 (88.5) | 11.5 | Clear lead |
| Minnesota | 444 (100) | 333 (92) | 8 | Within noise |
| Mississippi | 444 (100) | 333 (88.5) | 11.5 | Clear lead |
| Missouri | 444 (100) | 333 (96) | 4 | Within noise |
| Montana | 444 (100) | 333 (92) | 8 | Within noise |
| Nebraska | 444 (100) | 333 (96) | 4 | Within noise |
| Nevada | 444 (100) | 333 (100) | 0 | Tie |
| New Hampshire | 444 (100) | 333 (95.8) | 4.2 | Within noise |
| New Jersey | 444 (100) | 333 (96) | 4 | Within noise |
| New Mexico | 444 (100) | 333 (88.5) | 11.5 | Clear lead |
| New York | 444 (100) | 333 (96) | 4 | Within noise |
| North Carolina | 444 (100) | 333 (96) | 4 | Within noise |
| North Dakota | 444 (100) | 333 (78.6) | 21.4 | Clear lead |
| Ohio | 444 (100) | 333 (96) | 4 | Within noise |
| Oklahoma | 444 (100) | 333 (92.3) | 7.7 | Within noise |
| Oregon | 444 (100) | 333 (100) | 0 | Tie |
| Pennsylvania | 444 (100) | 333 (100) | 0 | Tie |
| Rhode Island | 444 (100) | 333 (100) | 0 | Tie |
| South Carolina | 444 (100) | 333 (92.3) | 7.7 | Within noise |
| South Dakota | 444 (100) | 333 (96) | 4 | Within noise |
| Tennessee | 444 (100) | 333 (96) | 4 | Within noise |
| Texas | 444 (100) | 333 (100) | 0 | Tie |
| Utah | 333 (104.2) | 444 (100) | 4.2 | Within noise |
| Vermont | 444 (100) | 333 (88.5) | 11.5 | Clear lead |
| Virginia | 444 (100) | 333 (92) | 8 | Within noise |
| Washington | 444 (100) | 333 (96) | 4 | Within noise |
| West Virginia | 444 (100) | 333 (95.8) | 4.2 | Within noise |
| Wisconsin | 444 (100) | 333 (92) | 8 | Within noise |
| Wyoming | 444 (100) | 333 (100) | 0 | Tie |
Through the year
When interest rises
Interest runs highest in summer. With the five-year trend removed, 16 of the 20 numbers peak between May and August (the shaded band), most often in June. The exceptions are 666 (April), 999 (October), 2222 (January), and 911 (September). Each chart uses the same scale, where 100 is a typical month and the dot marks the peak.
Peak Jul 106Low Jan 95
Peak Jun 106Low Nov 95
Peak Jun 107Low Jan 92
Peak Jul 105Low Sep 96
Peak Jun 106Low Sep 95
1111
Peak Jun 108Low Dec 93
Peak Jul 111Low Nov 93
Peak Aug 108Low Nov 94
Peak Jun 110Low Nov 93
Peak Apr 104Low Sep 96
1010
Peak Jun 109Low Feb 88
Peak Oct 105Low Nov 94
Peak Jan 129Low Apr 86
Peak Jun 108Low Nov 92
911
Peak Sep 110Low Nov 90
Peak May 110Low Feb 86
Peak Jun 108Low Jan 92
Peak Jul 108Low Aug 95
Peak Aug 110Low Jan 94
Peak Jun 110Low Feb 90
Seasonality table
| Number | Jan | Feb | Mar | Apr | May | Jun | Jul | Aug | Sep | Oct | Nov | Dec |
|---|---|---|---|---|---|---|---|---|---|---|---|---|
| 444 | 95 | 98 | 102 | 102 | 106 | 105 | 106 | 103 | 96 | 99 | 96 | 95 |
| 333 | 98 | 99 | 103 | 101 | 102 | 106 | 104 | 103 | 95 | 96 | 95 | 98 |
| 222 | 92 | 103 | 99 | 101 | 104 | 107 | 106 | 102 | 96 | 100 | 94 | 95 |
| 555 | 97 | 100 | 102 | 102 | 104 | 103 | 105 | 100 | 96 | 98 | 99 | 97 |
| 111 | 102 | 97 | 101 | 101 | 103 | 106 | 106 | 100 | 95 | 98 | 96 | 98 |
| 1111 | 95 | 95 | 99 | 103 | 107 | 108 | 108 | 103 | 97 | 97 | 97 | 93 |
| 777 | 93 | 100 | 101 | 103 | 104 | 107 | 111 | 101 | 95 | 99 | 93 | 93 |
| 888 | 95 | 97 | 99 | 102 | 104 | 104 | 108 | 108 | 95 | 100 | 94 | 96 |
| 1212 | 93 | 94 | 98 | 101 | 107 | 110 | 107 | 101 | 95 | 95 | 93 | 108 |
| 666 | 100 | 100 | 102 | 104 | 104 | 103 | 103 | 99 | 96 | 103 | 96 | 96 |
| 1010 | 89 | 88 | 94 | 104 | 107 | 109 | 109 | 104 | 99 | 106 | 95 | 97 |
| 999 | 95 | 97 | 101 | 101 | 103 | 103 | 104 | 103 | 99 | 105 | 94 | 95 |
| 2222 | 129 | 112 | 92 | 86 | 89 | 93 | 88 | 92 | 88 | 89 | 114 | 116 |
| 1234 | 101 | 100 | 101 | 102 | 101 | 108 | 105 | 103 | 95 | 97 | 92 | 103 |
| 911 | 95 | 98 | 101 | 102 | 104 | 104 | 106 | 100 | 110 | 94 | 90 | 95 |
| 000 | 88 | 86 | 99 | 107 | 110 | 108 | 108 | 107 | 96 | 101 | 92 | 94 |
| 1122 | 92 | 97 | 102 | 106 | 102 | 108 | 105 | 100 | 94 | 102 | 101 | 97 |
| 1313 | 97 | 103 | 100 | 103 | 107 | 104 | 108 | 95 | 97 | 98 | 101 | 95 |
| 1717 | 94 | 94 | 95 | 96 | 106 | 105 | 101 | 110 | 103 | 105 | 96 | 100 |
| 1818 | 97 | 90 | 104 | 99 | 105 | 110 | 105 | 99 | 102 | 98 | 98 | 97 |
Over five years
Five years of cooling interest
Every one of the 20 numbers drew less interest in the latest 52 weeks than in the first 52. The median change is −50%, from −32% for 888 to −66% for 911. Interest in 444 peaked in the week of February 27, 2022. Each chart below is on its number’s own scale, where its busiest week is 100.
How we did it
How we built the Atlas
We collected the data from the Google Trends website on September 28, 2026, covering September 26, 2021 to September 27, 2026. The raw pull, the build script, and the output are all kept with the site, so every number on this page can be rebuilt.
- Each term was entered as “<number> angel number” for the United States over the past five years, all categories, web search.
- State indices come from each term pulled alone, so every map is scaled to that term’s own top state (100) and maps cannot be compared across terms.
- National indices come from batches of up to five terms that all include “444 angel number”, each rescaled so 444 = 100 within its own batch, which puts every term on one scale.
- Seasonality divides each week by the centered 52-week average around it, which removes the five-year trend, then averages those ratios by calendar month (100 = a typical month).
- Five-year change compares the latest 52 weeks with the first 52 weeks of each term’s own series.
- A state’s favorite number compares terms inside that state using the same anchored batches (444 = 100). Leads under 10 points are within Trends sampling noise and are marked as close.
- Google Trends reports 0 when a state has too little data for a term; the Atlas shows those as insufficient data, not zero interest.
What this data cannot tell you
Google Trends reports relative interest from a sample of Google activity. It does not count people, and it does not say why anyone looked a number up, whether they saw it on a clock, heard it in a song, or wanted a meaning. A high score for a state means the term made up a larger share of that state’s Google activity, so smaller states can rank high. Trends samples can shift slightly between pulls. Our sources and method page explains how we keep data like this apart from spiritual readings.
Free to use
Use and cite the data
Reporters, researchers, and writers are welcome to use the Atlas. Please link to this page and include Google’s required citation: Data source: Google Trends (https://www.google.com/trends)
1,020 rows: the index for every number in every state and DC, with each number’s national index and rank. Blank cells mean there wasn’t enough data.
Citation
Divine Numbers, “The Angel Number Atlas,” September 28, 2026, https://divinenumbers.co/angel-number-atlas/. Data source: Google Trends (https://www.google.com/trends).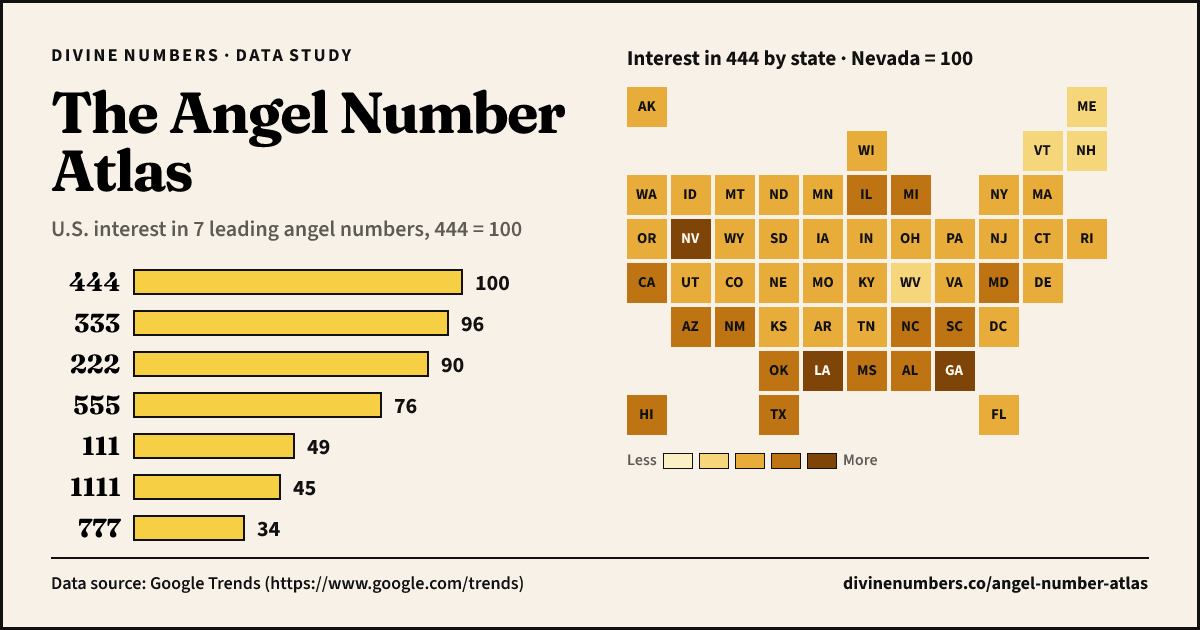
Embed code
<figure>
  <a href="https://divinenumbers.co/angel-number-atlas/">
    <img src="https://divinenumbers.co/angel-atlas-embed.png" width="1200" height="630"
      alt="The Angel Number Atlas: 444 leads U.S. interest in angel numbers, and Nevada ranks first for most numbers.">
  </a>
  <figcaption>
    <a href="https://divinenumbers.co/angel-number-atlas/">The Angel Number Atlas</a> by Divine Numbers.
    Data source: Google Trends (https://www.google.com/trends).
  </figcaption>
</figure>
Frequently asked
Questions about the Atlas
What is the most popular angel number?
On Google Trends, 444 draws the most interest of the 20 angel numbers in the Atlas. Over five years, 333 ran at 96% of 444’s level and 222 at 90%. Trends measures relative interest in a search term, not how many people use or value a number.
Which state looks up angel numbers the most?
Nevada. With each number scaled to its own top state, Nevada scores 100 for 15 of the 20 numbers, sometimes shared, and ranks in the top five for all 20. Georgia scores 100 for six. Scores are shares of each state’s Google activity, so a small state can rank high.
When do people look up angel numbers most?
In summer. After removing the five-year trend, 16 of the 20 numbers peak between May and August, most often in June. The exceptions are 666 (April), 999 (October), 2222 (January), and 911 (September).
Is interest in angel numbers growing?
Not on Google. All 20 numbers drew less interest in the latest 52 weeks than in the first 52 weeks of the five-year window, with a median change of −50%. Interest in 444 peaked in the week of February 27, 2022.
Why can’t I compare colors between maps?
Google Trends scales each number to its own top state, which scores 100. A 60 on the 444 map and a 60 on the 1818 map describe very different amounts of interest. To compare numbers, use the national ranking, which puts every number on the 444 = 100 scale.
Can I use this data?
Yes. Download the CSV, embed the image, or quote the findings with a link to this page and the citation “Data source: Google Trends (https://www.google.com/trends)”. The underlying data comes from Google Trends and remains subject to Google’s terms.
Sources and licenses
Where the data and map come from
- Google Trends: relative interest for “<number> angel number”, United States, past five years, all categories, web search. Data source: Google Trends (https://www.google.com/trends). The indices on this page are derived from it and remain subject to Google’s terms of service.
- “Blank US Map (states only)” by Heitordp, Wikimedia Commons: the state outlines on the desktop map, dedicated to the public domain (CC0). The tile-grid map is our own layout.
.svg)